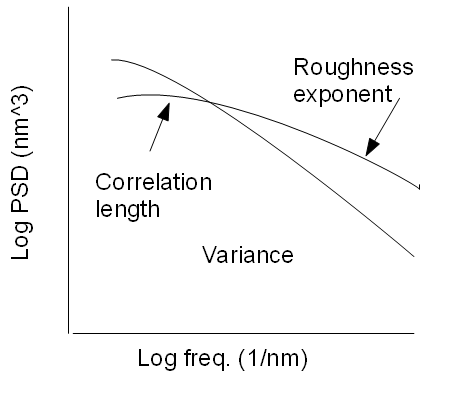
Chris Mack gave an insightful talk on line edge roughness (LER). One of the points he made is that talking about σ_LER is not enough. Consider the power spectral density (PSD) plots in the figure.  Which curve shows “better” LER? If both curves integrate to the same area, they cannot be distinguished by the variance (σ^2). We must also consider the correlation length and roughness exponent. The correlation length influences where the “break” of the curve appears, while the roughness exponent influences how rapidly the curve declines from there. (The PSD plot of white noise would be a horizontal line.)
A recent article in JMM attempts to quantify just this effect, that the impact of LER is not constant with constant variance. One must instead specify the PSD at least to the level of the three parameters: variance, correlation length, and roughness exponent.